Reference Data
The reference data option is shown on the Pack Menu
It can be used to include reference or target data into your pack for display on a Bar Chart as a line or a band
Add Reference data
There are 3 options for reference data that may be added
- Single Values: Enter a single value split by a text property to add a line to a chart e.g budget salary by department
- Min and Max: Enter an upper and lower value split by a text property to apply a band to a chart e.g. salary range by grade
- Form: A single reference value not split by any property e.g. total company revenue
To add data:
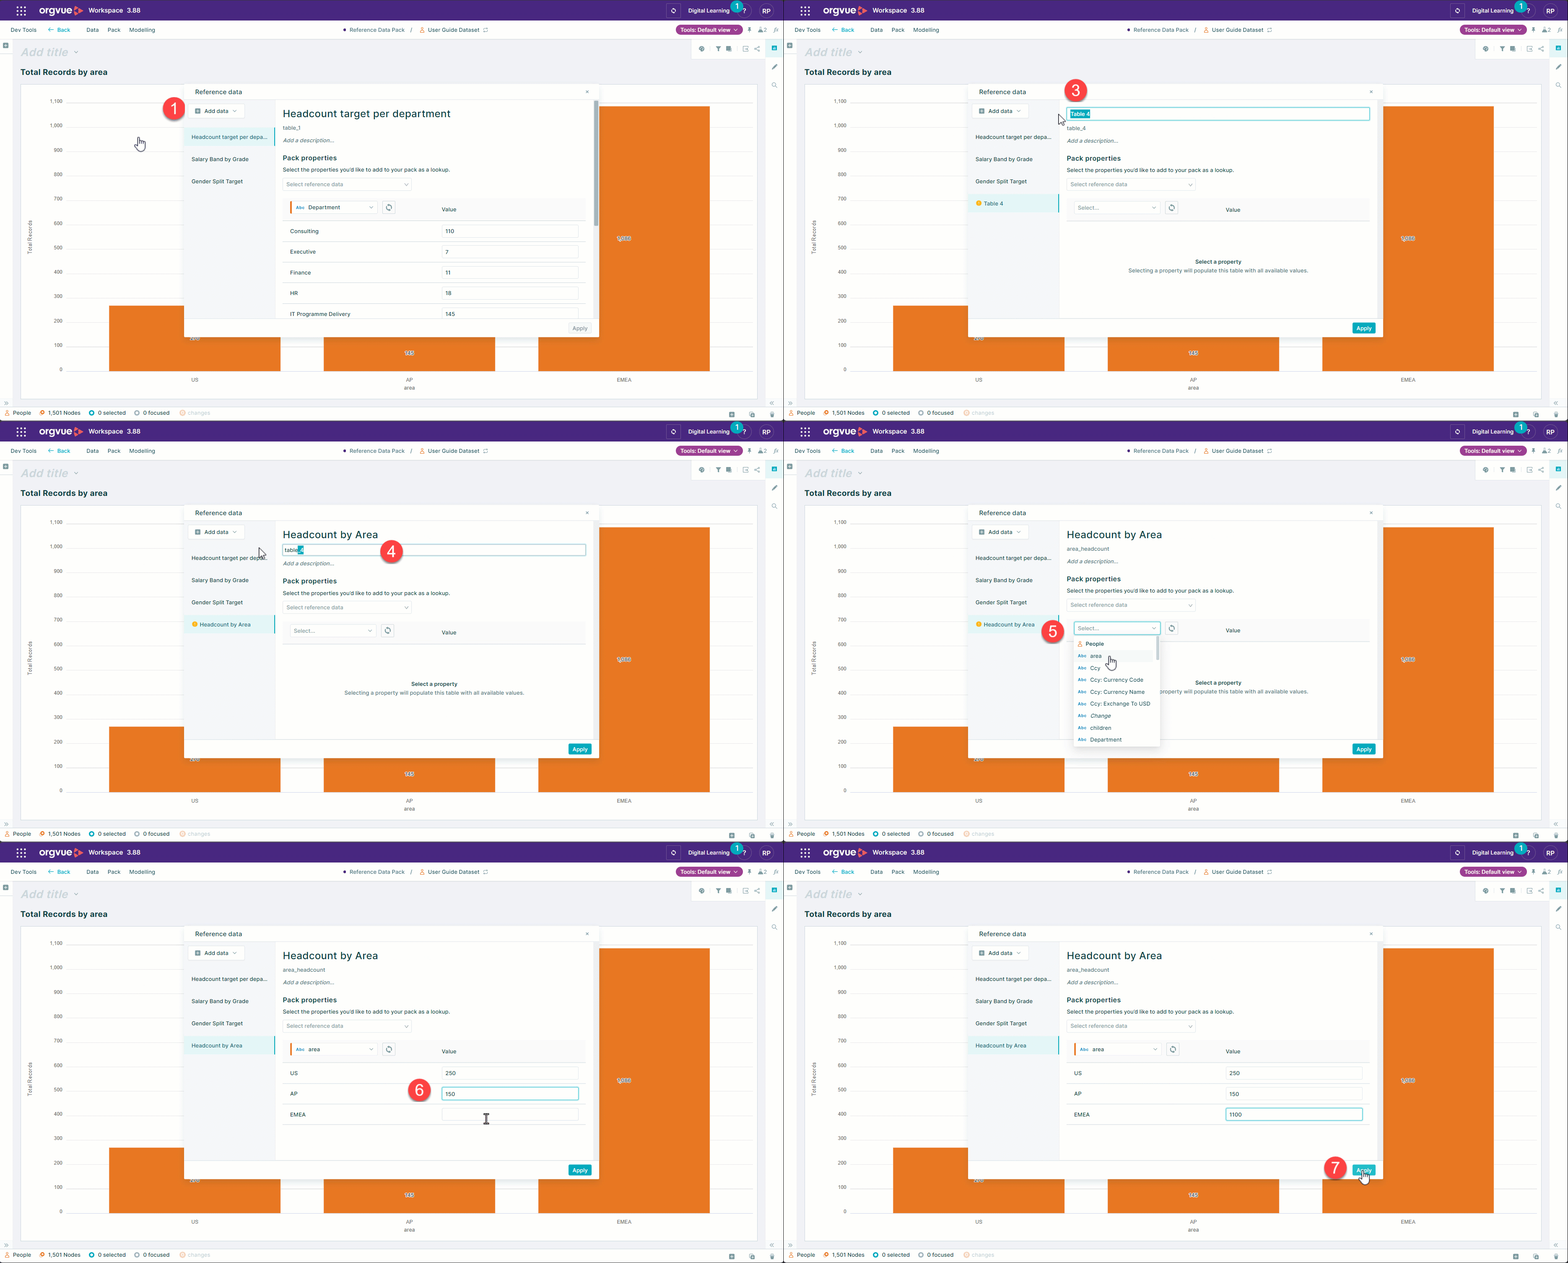
- Select the
+ Add databutton - Select the required type from the options above
- Enter a name for the reference data
- Enter a key for the reference data (this may be used in Gizmo calculations)
- Select a text property to split data by
- Enter values into table
- Select
Apply
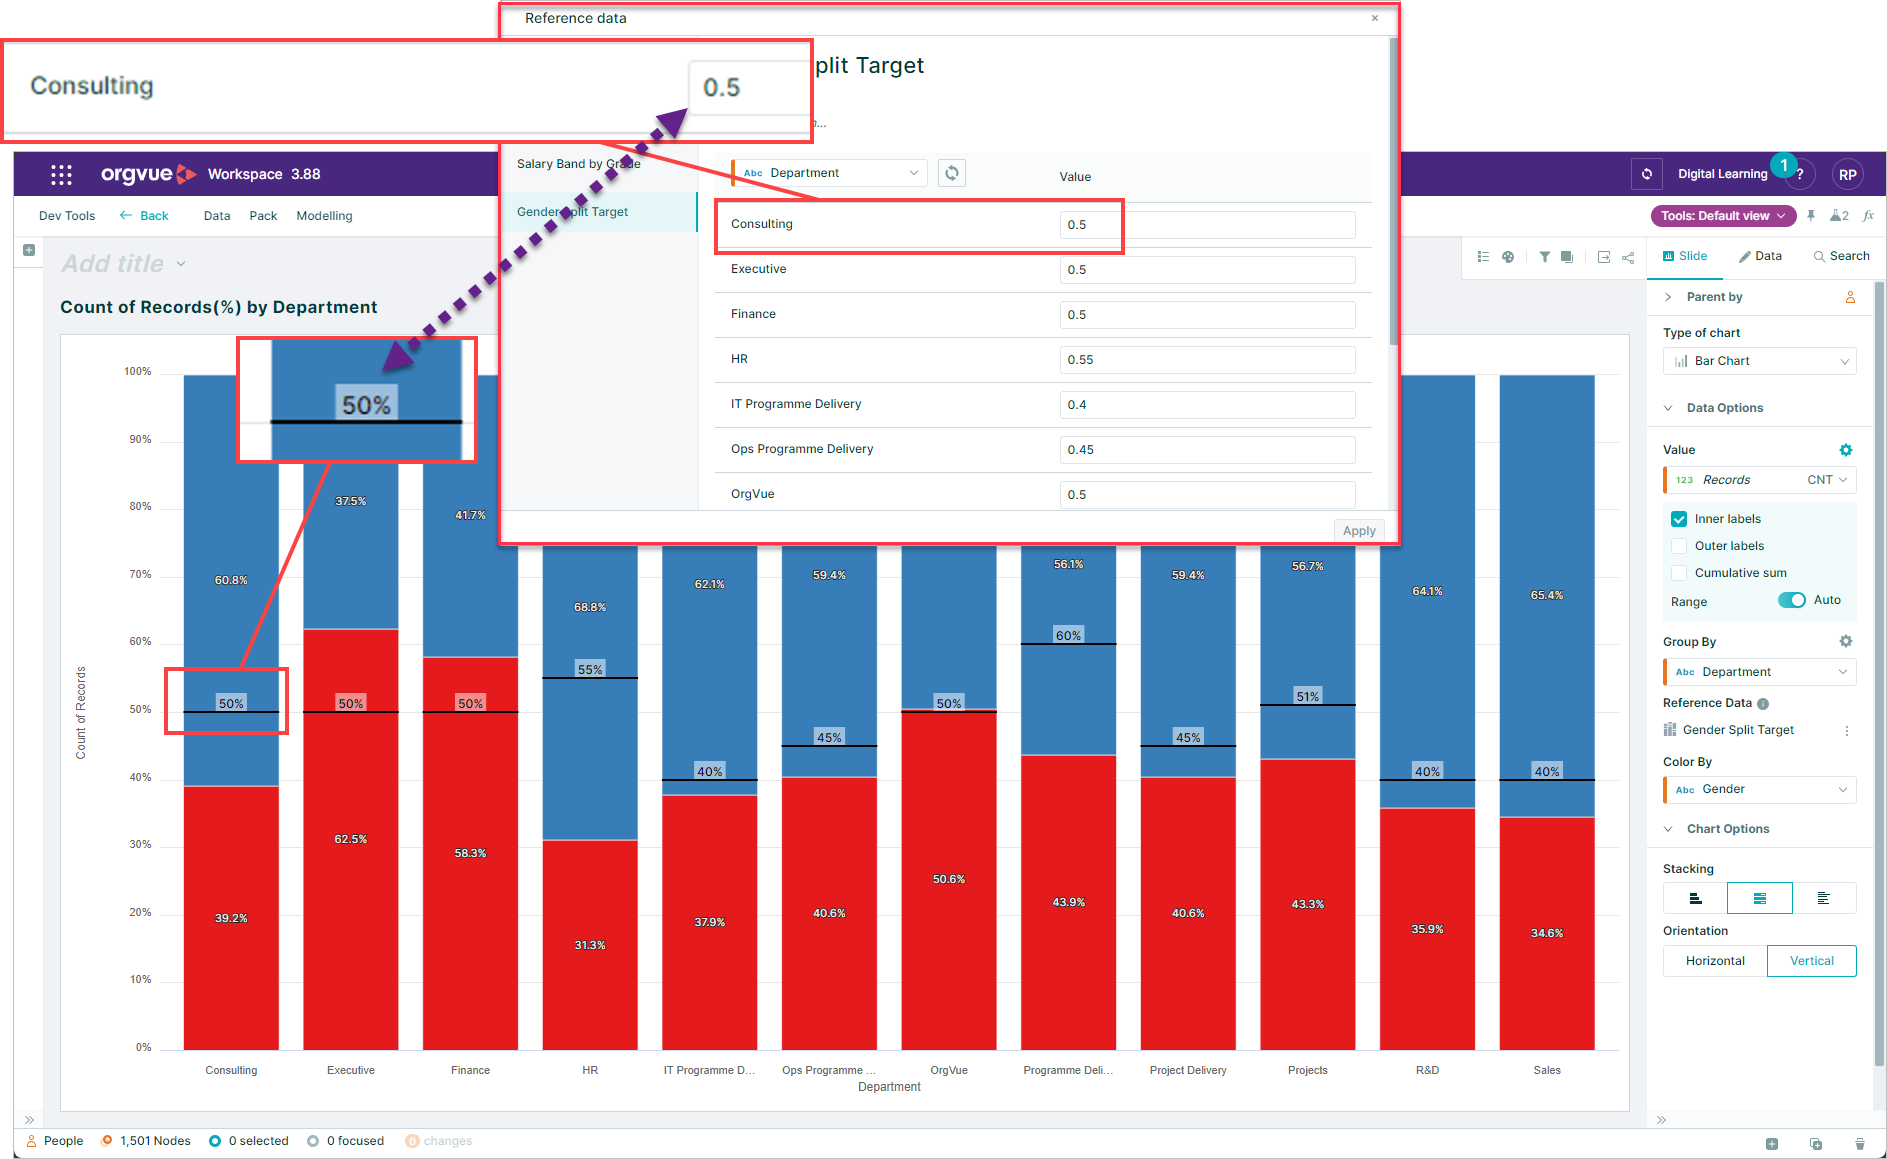
Add Percentage Reference Data
When adding reference data to be used on stacked percentage charts values should be entered into table between 0 and 1 and these will then be displayed as 0% to 100% on the charts
Using Reference Data on Charts
Reference data may be added to bar and cluster charts as a line or a band with the option of also displaying a value label
The reference data can only be displayed on charts when the same property is used to Group By on the chart and to enter the values in the reference data table
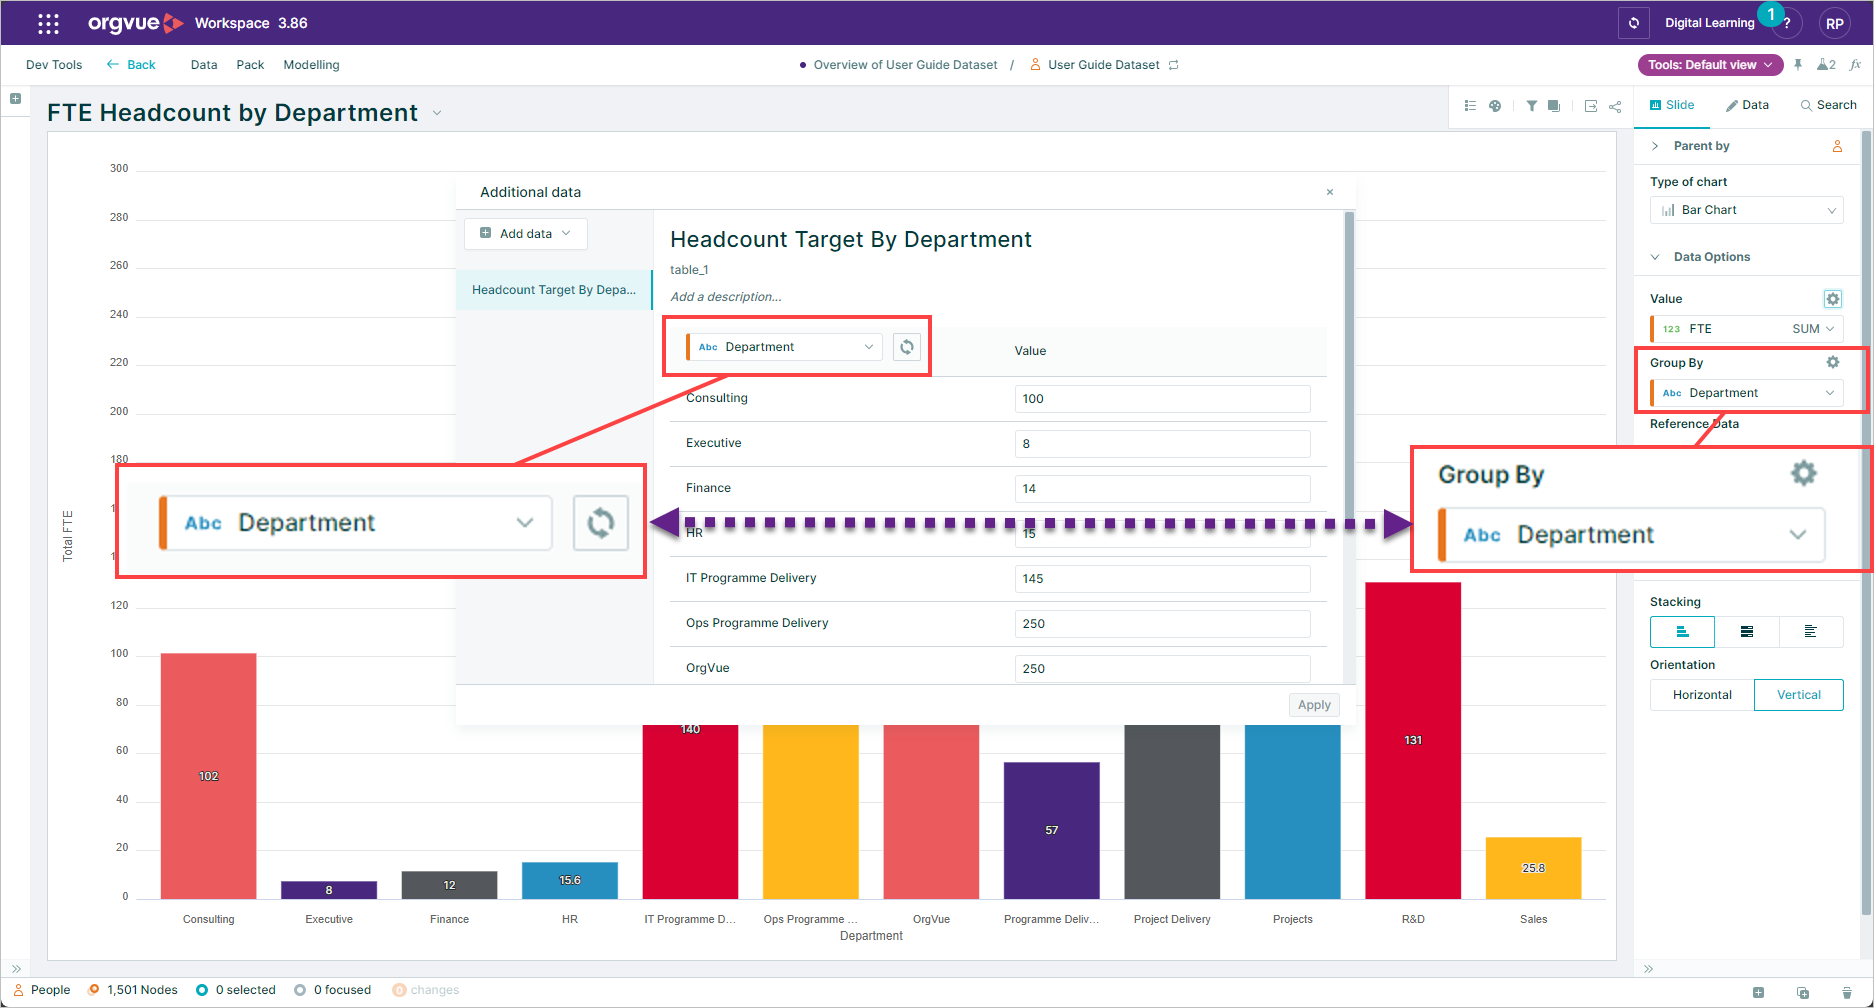
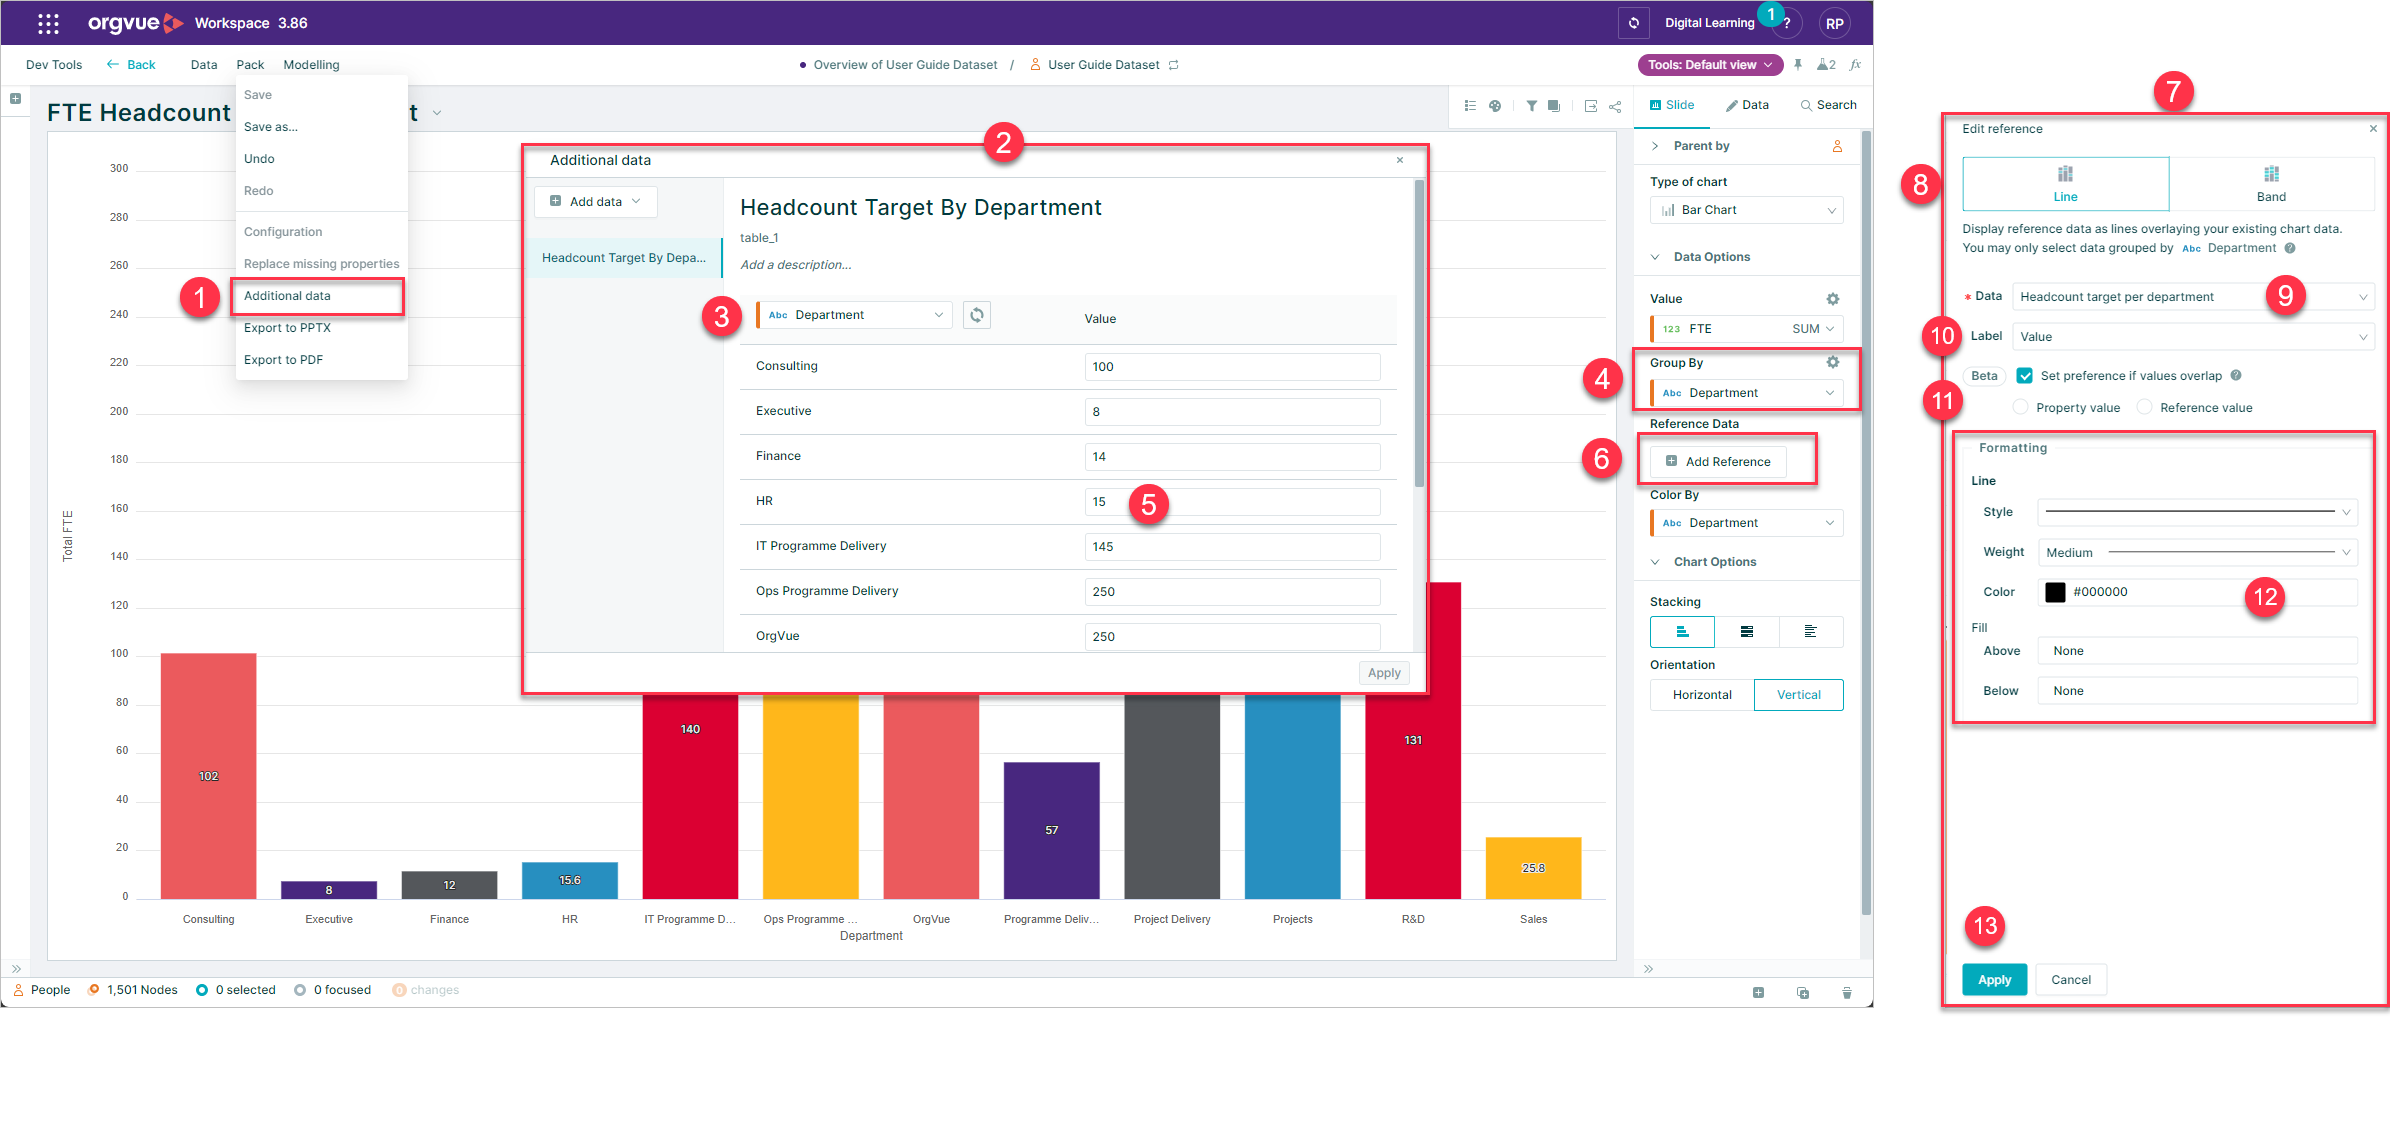
To add reference data to a bar or cluster chart:
- Select the
Additional dataoption on the pack menu - This will open the Reference data modal
- Follow the steps to Add Reference data selecting a property to split the data by
- This property must match the property selected to
Group Byon the chart - Add data values to use as targets
- Select the
+ Add Referencebutton - This will open the Add Reference modal
- Choose to display reference data as either Line or Band
- Select the required Reference data from the drop down
- Choose to show a value label or simply a line
- Check box to Set preference if property and reference values overlap on chart
- Select line formatting and fill options See Formatting Options for further details
- Select
Apply
Save Reference Data as Pack Property
Any reference data that has been entered can also be saved as a pack property so that it may be used in other slide types
To save as a pack property:
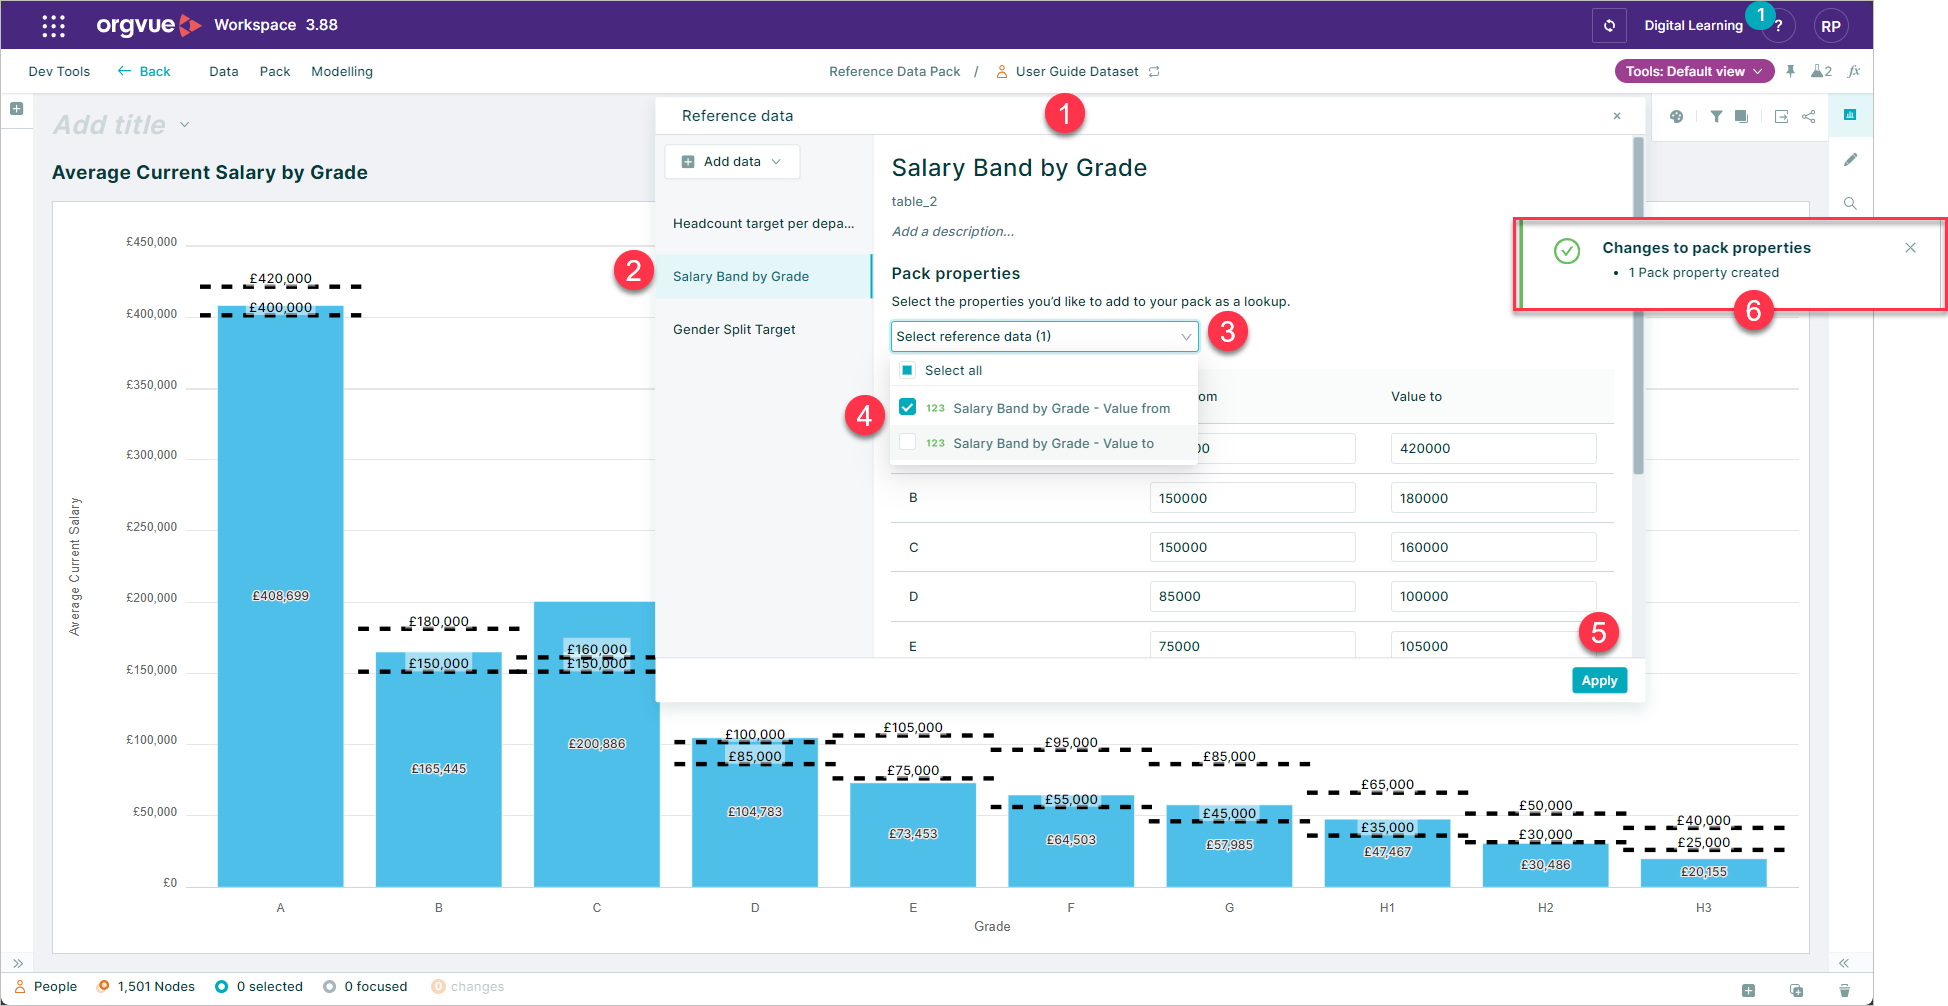
- Open the Reference Data modal
- Select the required reference data table
- Select the pack properties dropdown
- Check the box for the required property to be saved
- Select
Apply - A confirmation message will then be shown
When saving a pack property from a min / max reference table the Value from and Value to will be available to save as two distinct properties
Deleting Reference Data Pack Properties
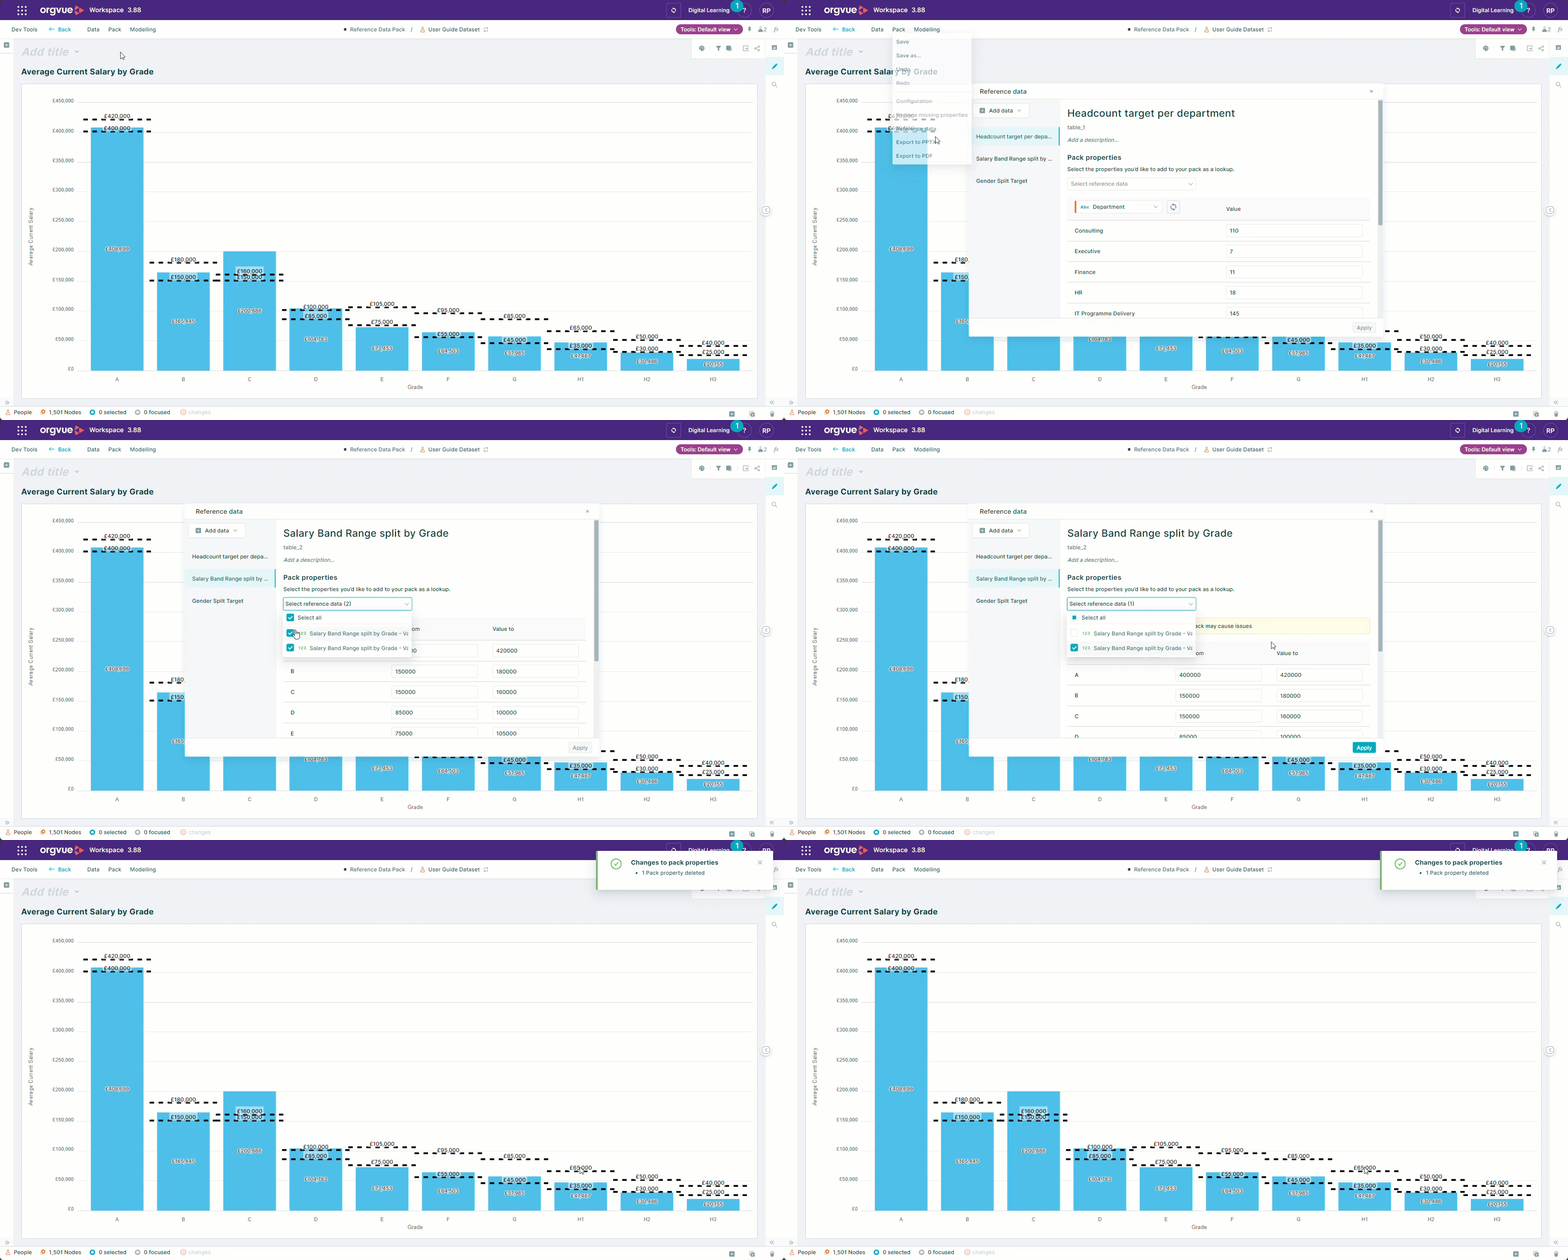
Any Reference Data values that have been saved as pack properties may be deleted by unchecking the property on the reference data modal and selecting apply
Label Preference
When displaying Reference Data lines or bands on your charts along their value labels you may find that the property labels overlap on your charts
To prevent this it is possible to select your preferred value to display when data overlaps.
"Reference value" shows the expected reference data, while "Property value " displays the actual measured data.
To set your label preference:
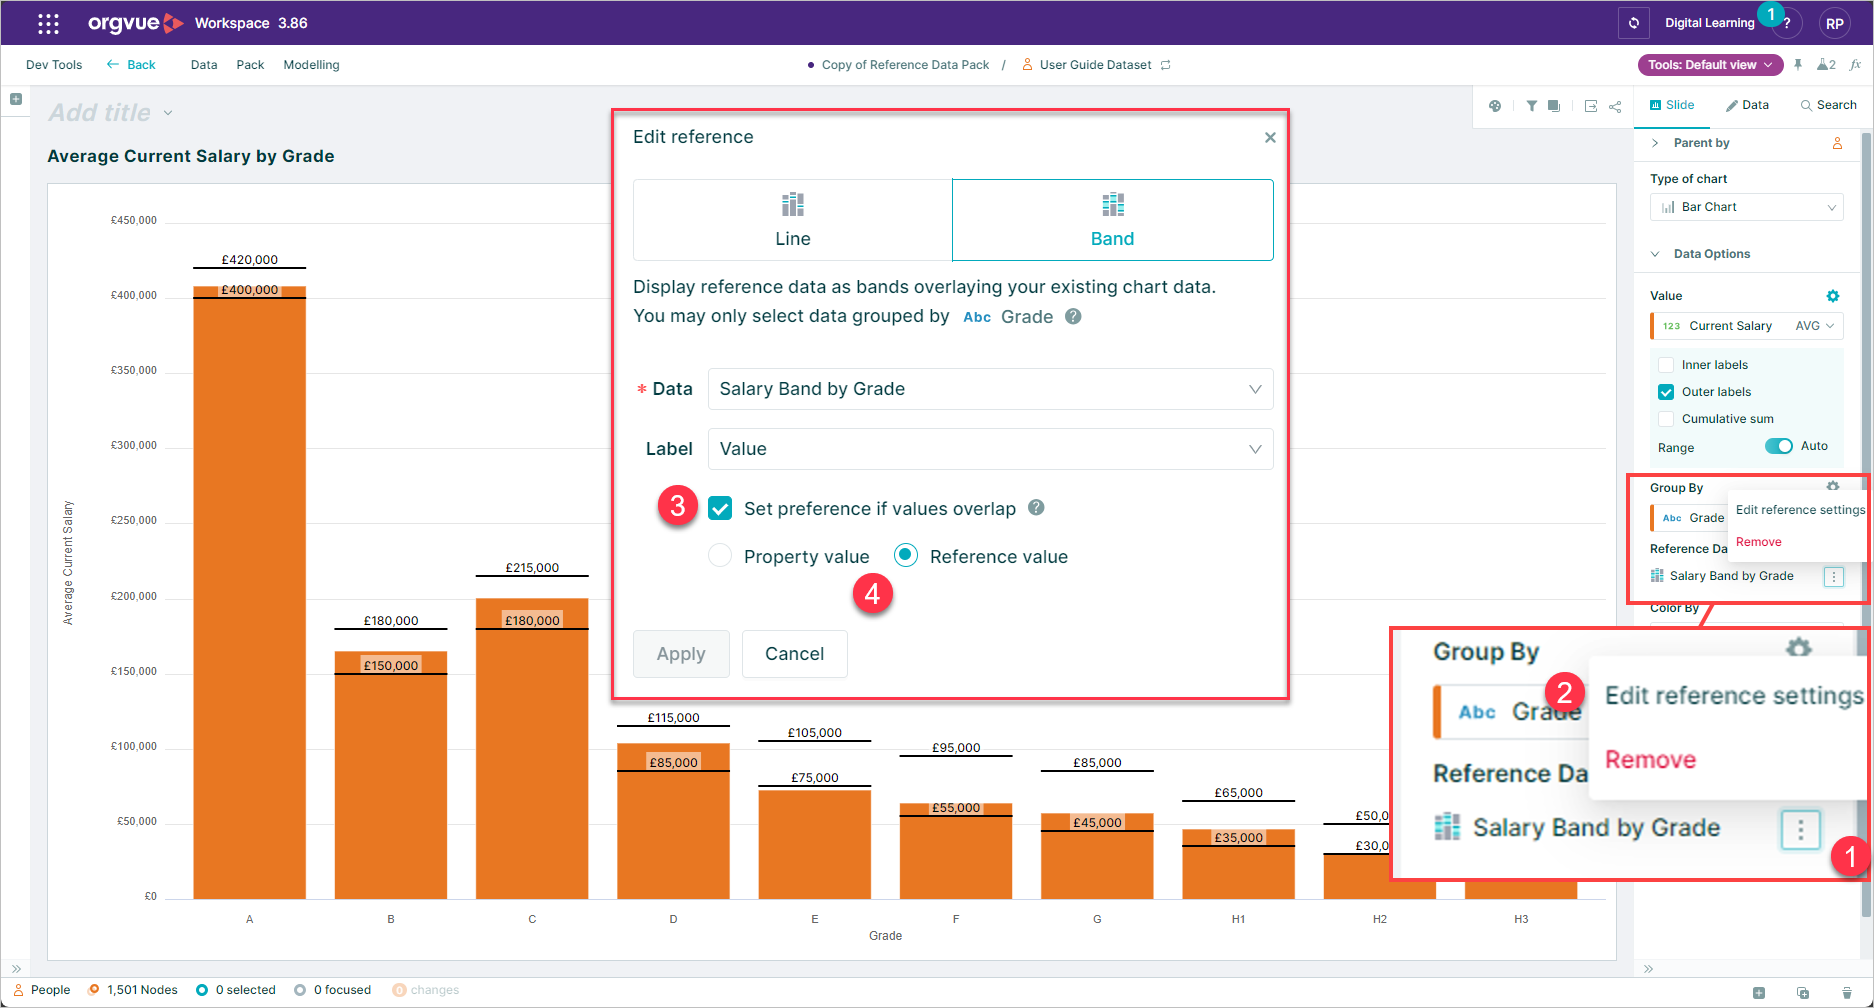
- Select the ellipsis button
- Select
Edit reference settingsto open the modal - Select checkbox to enable to Set preference option
- Select to display either
Property valueorReference value
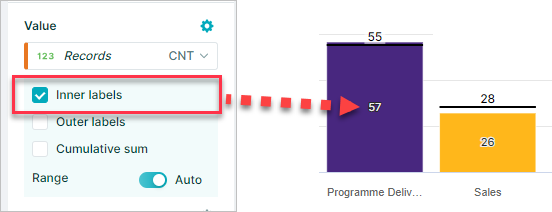
When adding Reference Data to your charts, best practice is to set the labels for actual data values to Inner labels to ensure Reference Data labels are visible
Reference Data Formatting Options
There are a number of options to customise line style and color for your reference data:
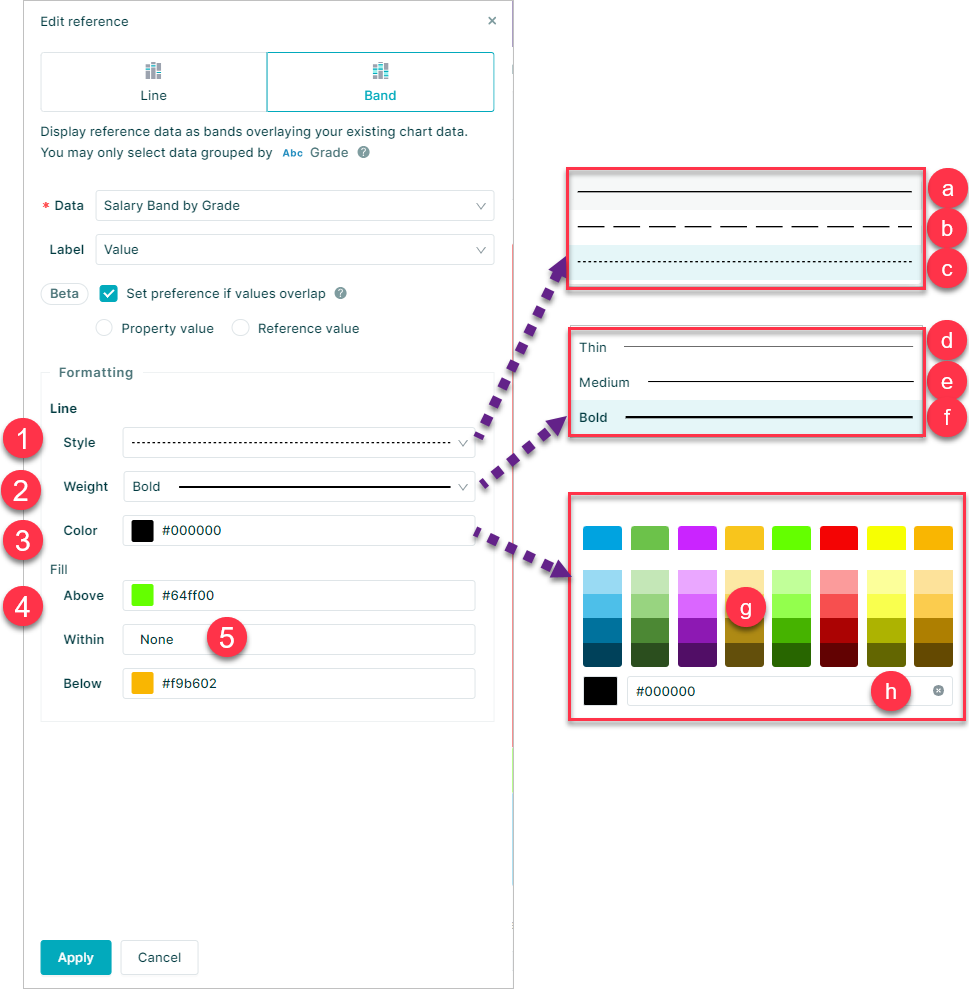
- Line Style
- a. Line
- b. Dash
- c. Dots
- Line Weight
- d. Thin
- e. Medium
- f. Bold
- Line Color
- g. Select line color from
- h. Alternatively a color hex code may be entered
- Fill colors may be applied above and below reference lines.
- Reference bands also allow fill color to be selected within the band
Using Reference Data with Gizmo
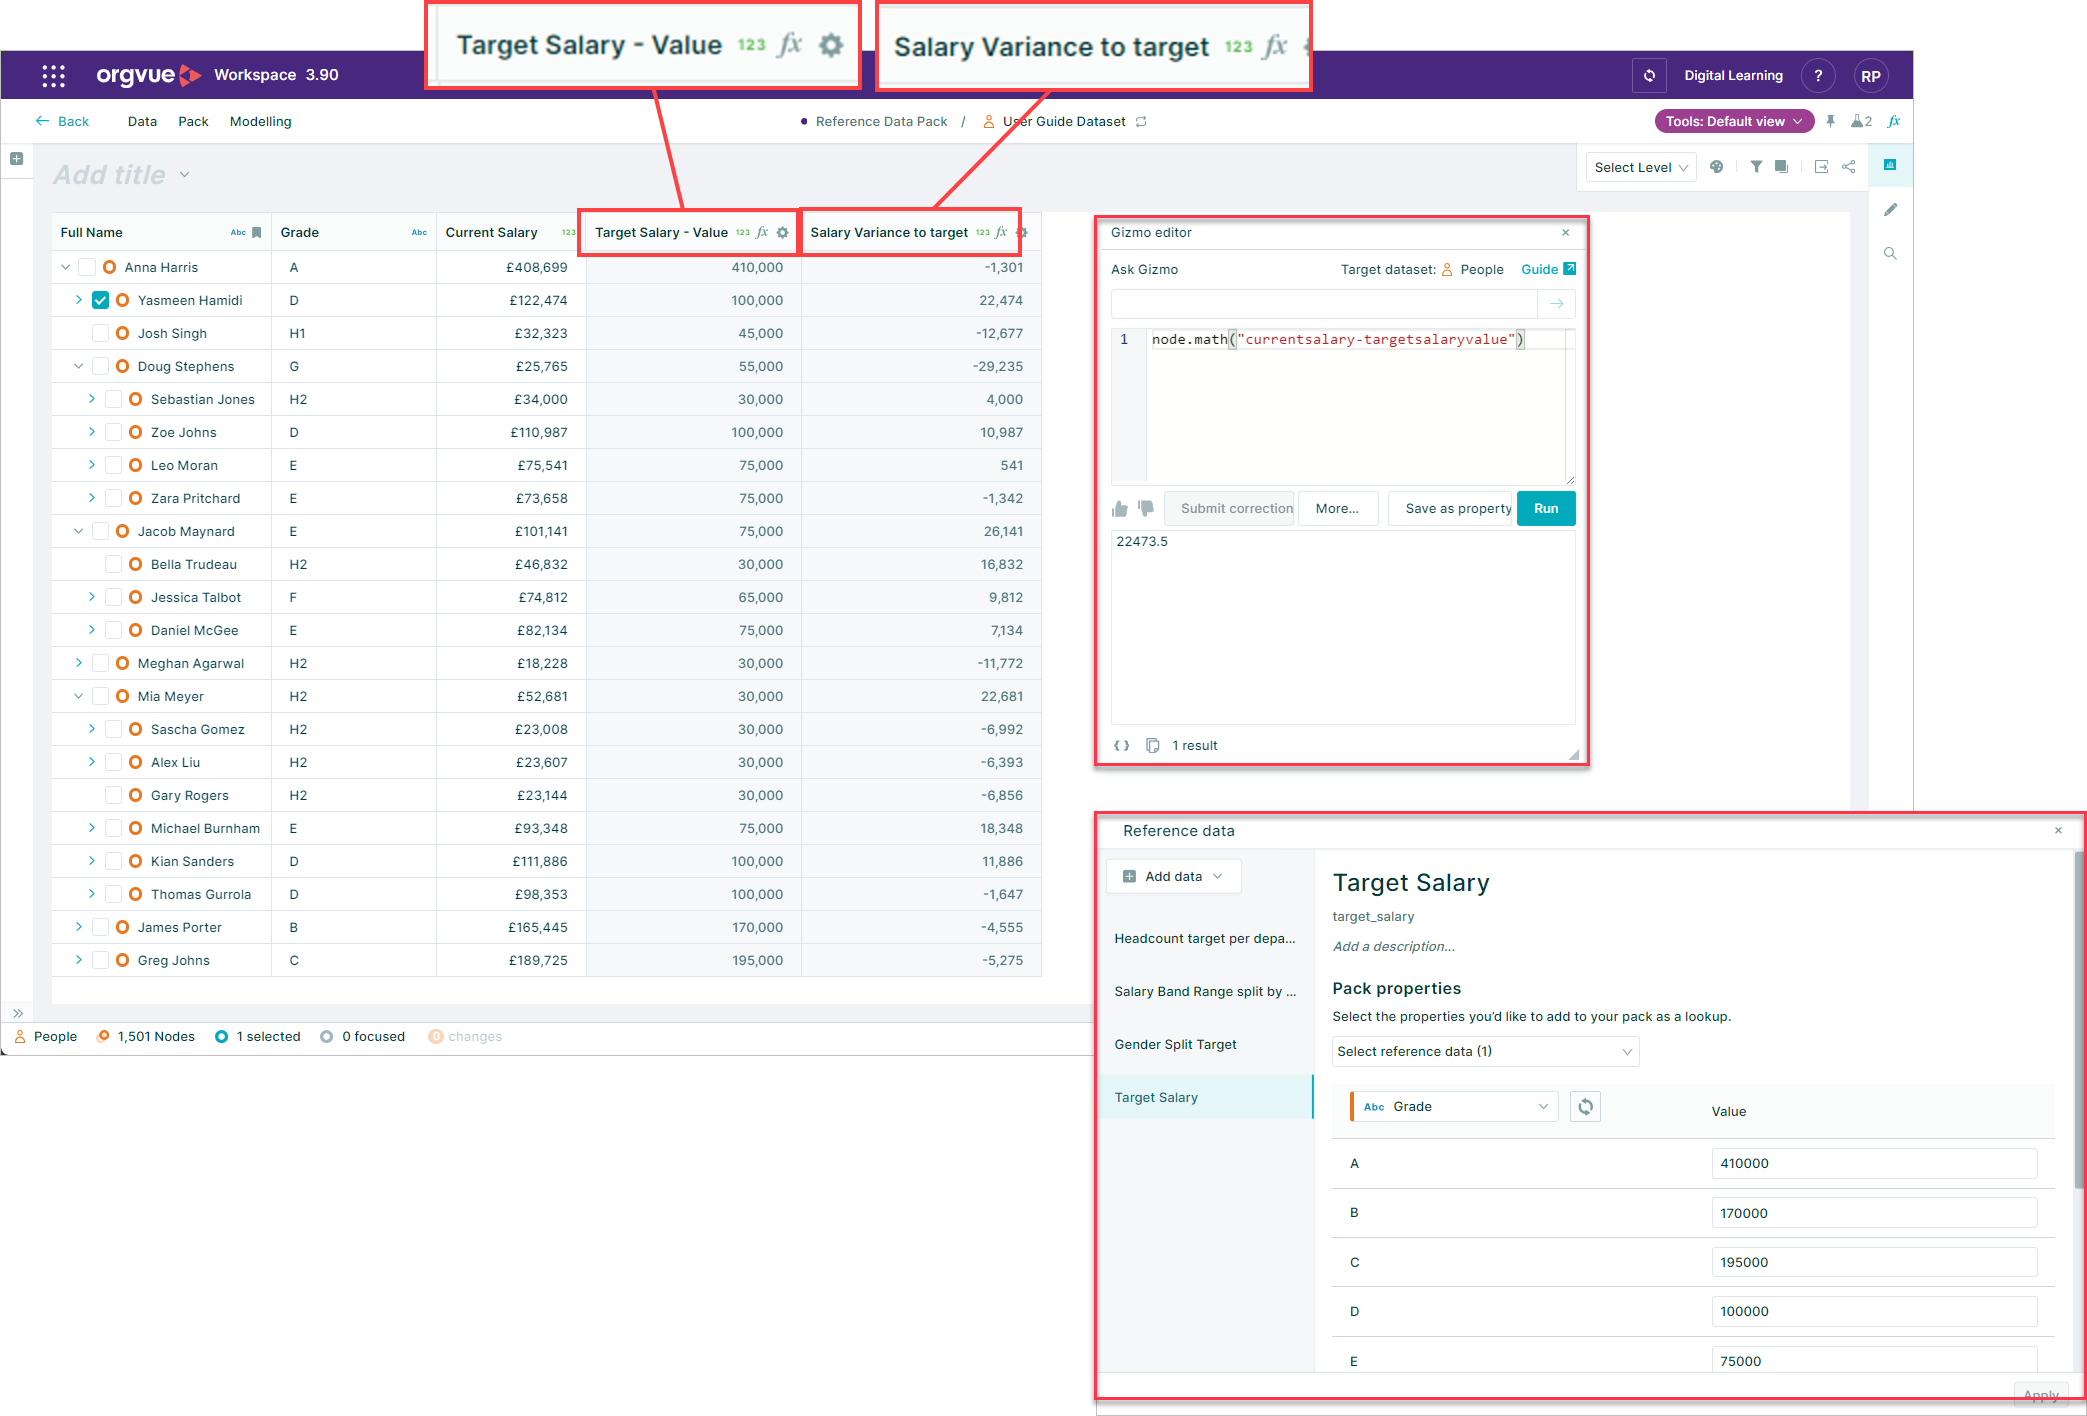
Any data entered in a reference table can be used within Gizmo calculations by Saving as a Pack Property
This will enable the you to perform calculations such as the difference between actual values and reference target values