Property Types & Patterns Dashboard
This data dashboard is a pre built slide that may be used with any dataset type to quickly get an understanding of the property types and data quality within it.
To get the Property Types & Patterns Dashboard added to your tenant speak to your Orgvue representative or email support@orgvue.com for assistance
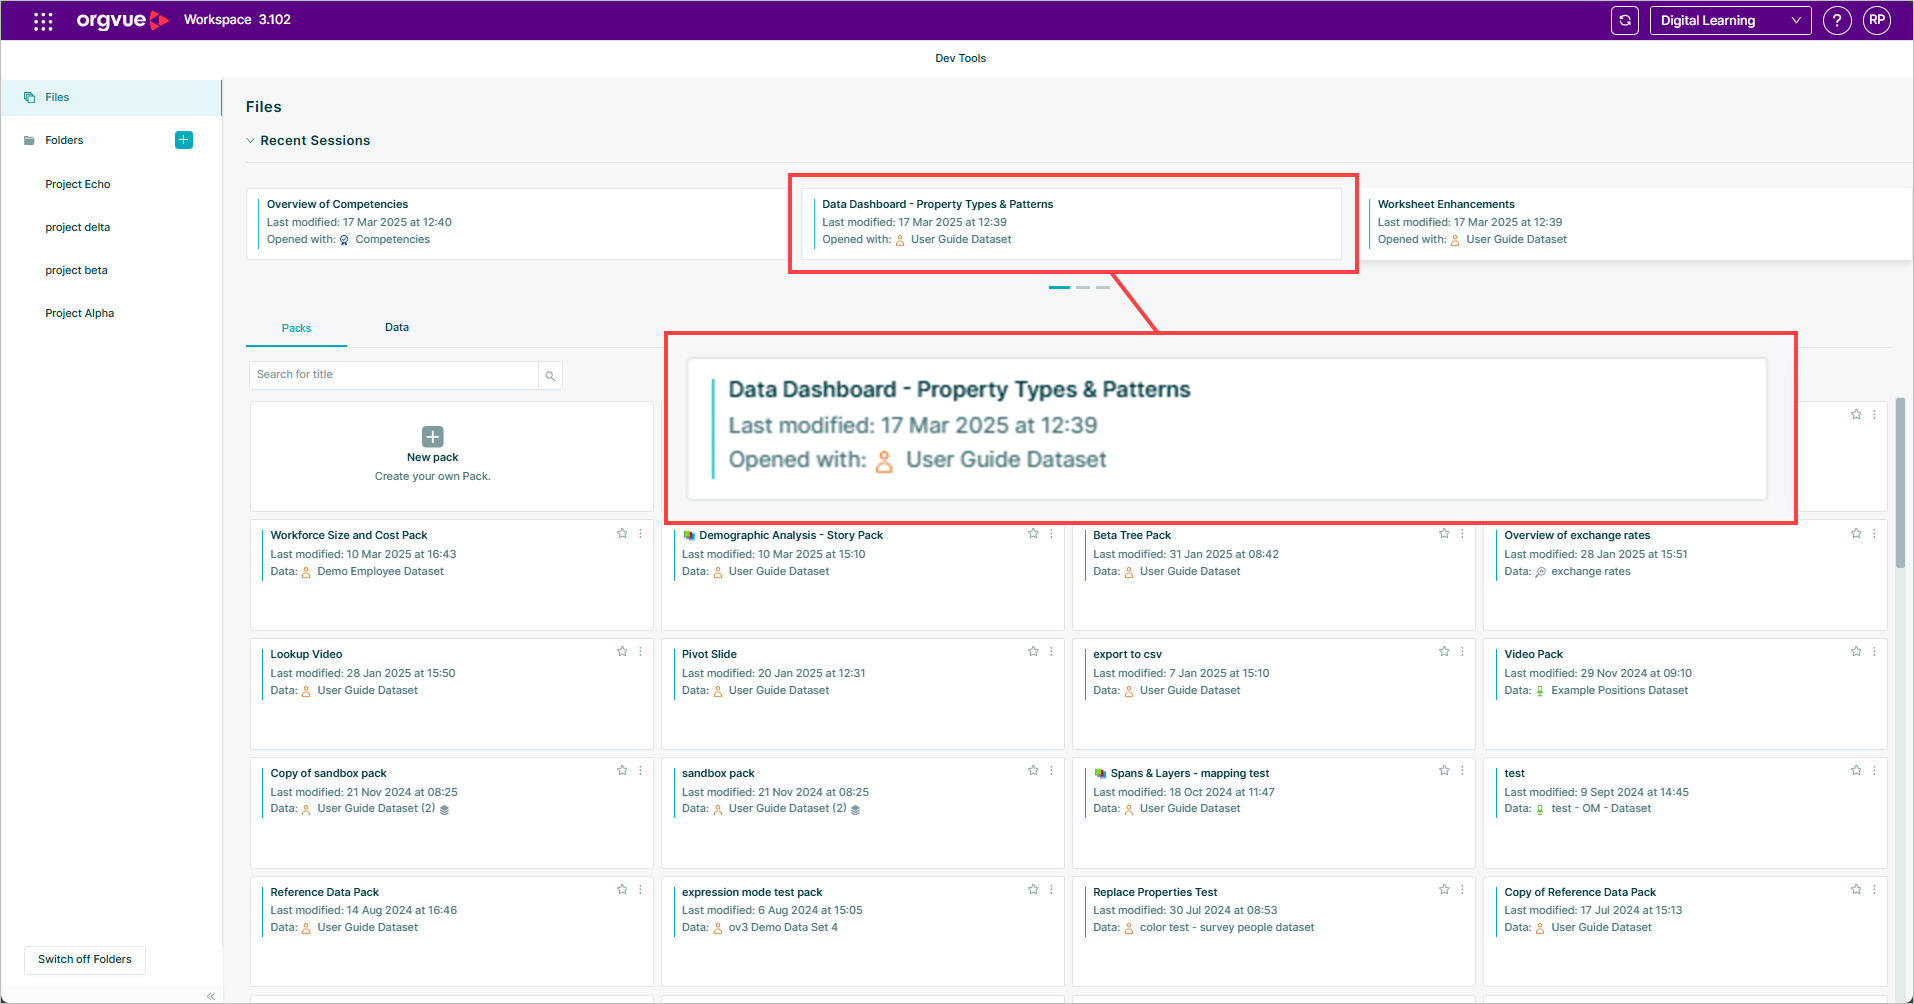
Accessing the Property Types Dashboard
The data dashboard is not available on the Add Slide Panel.
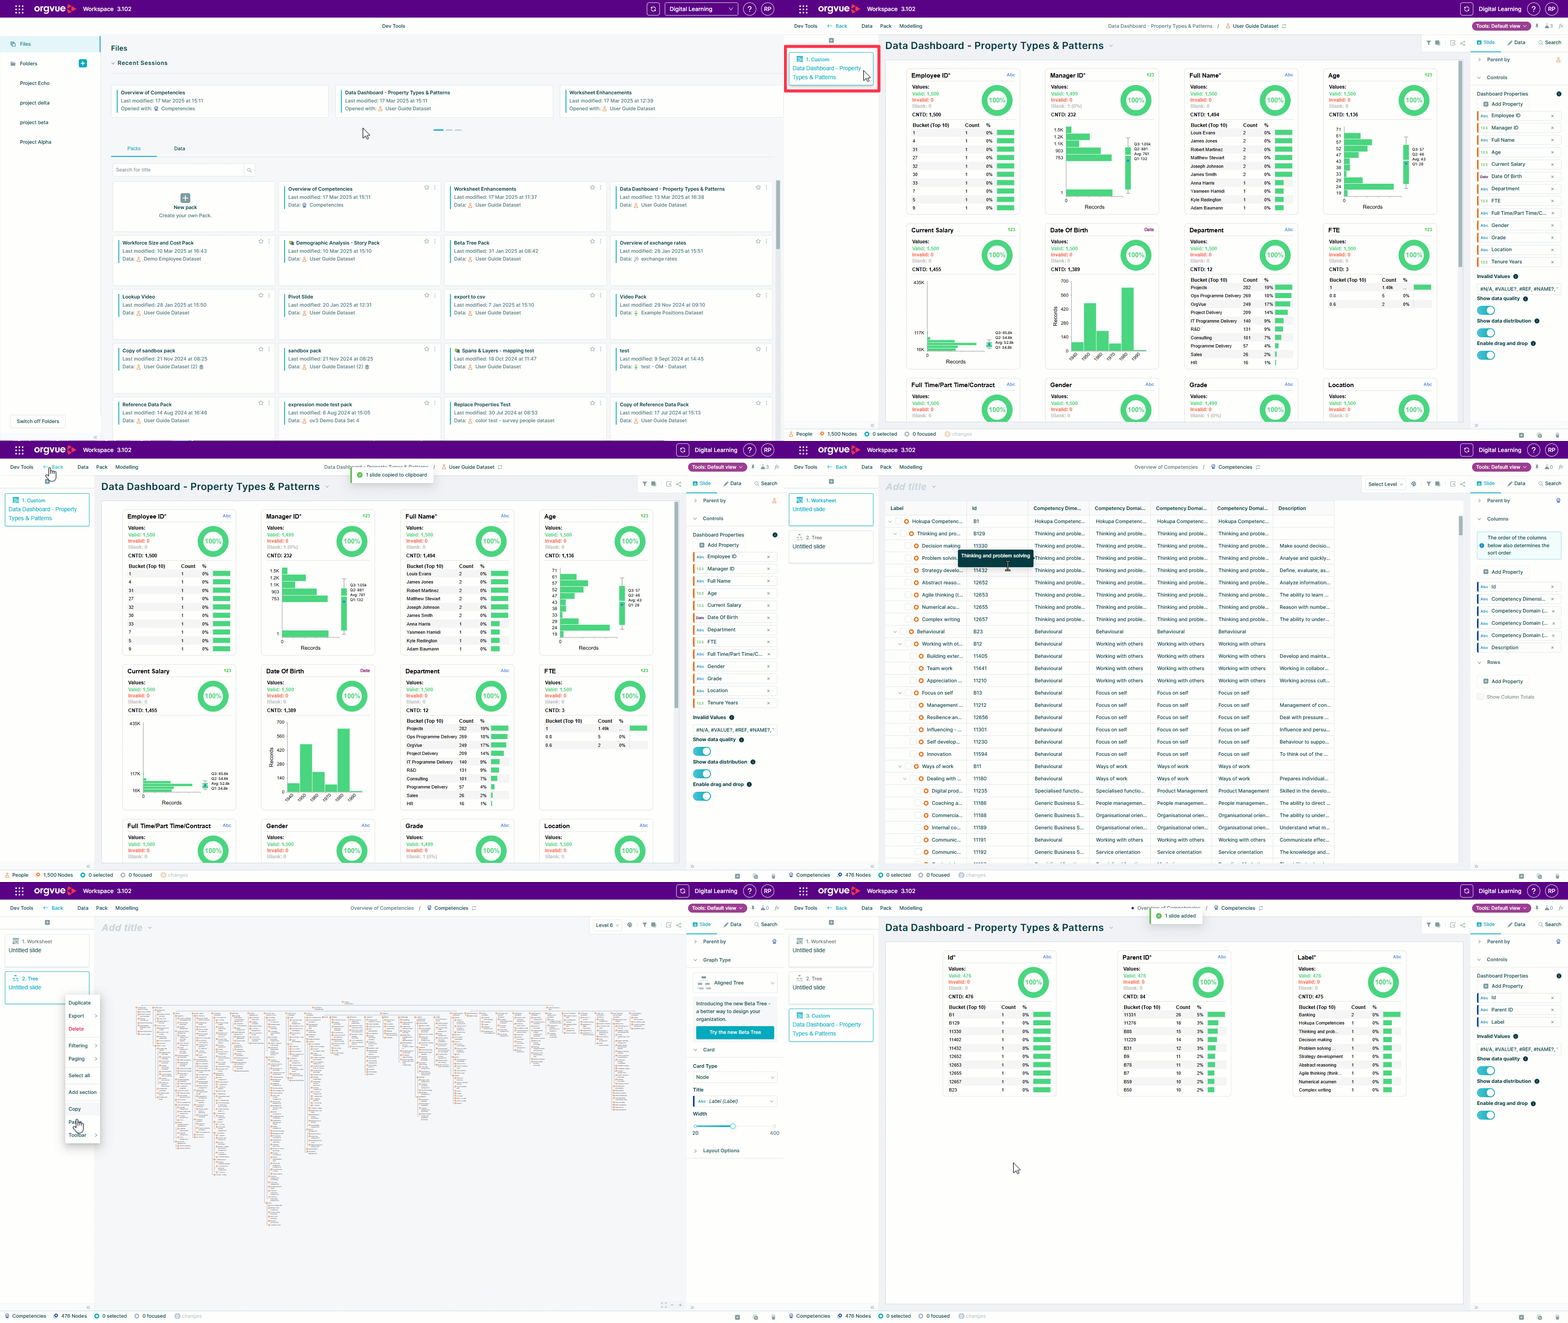
Instead, it is added to your tenant upon request as a pack containing the dashboard slide
It is then possible to Copy Slide from this pack and Paste Slide into any other pack within your tenant
Using the Property Types & Patterns Dashboard
The dashboard will work with any dataset type and has a number of controls available
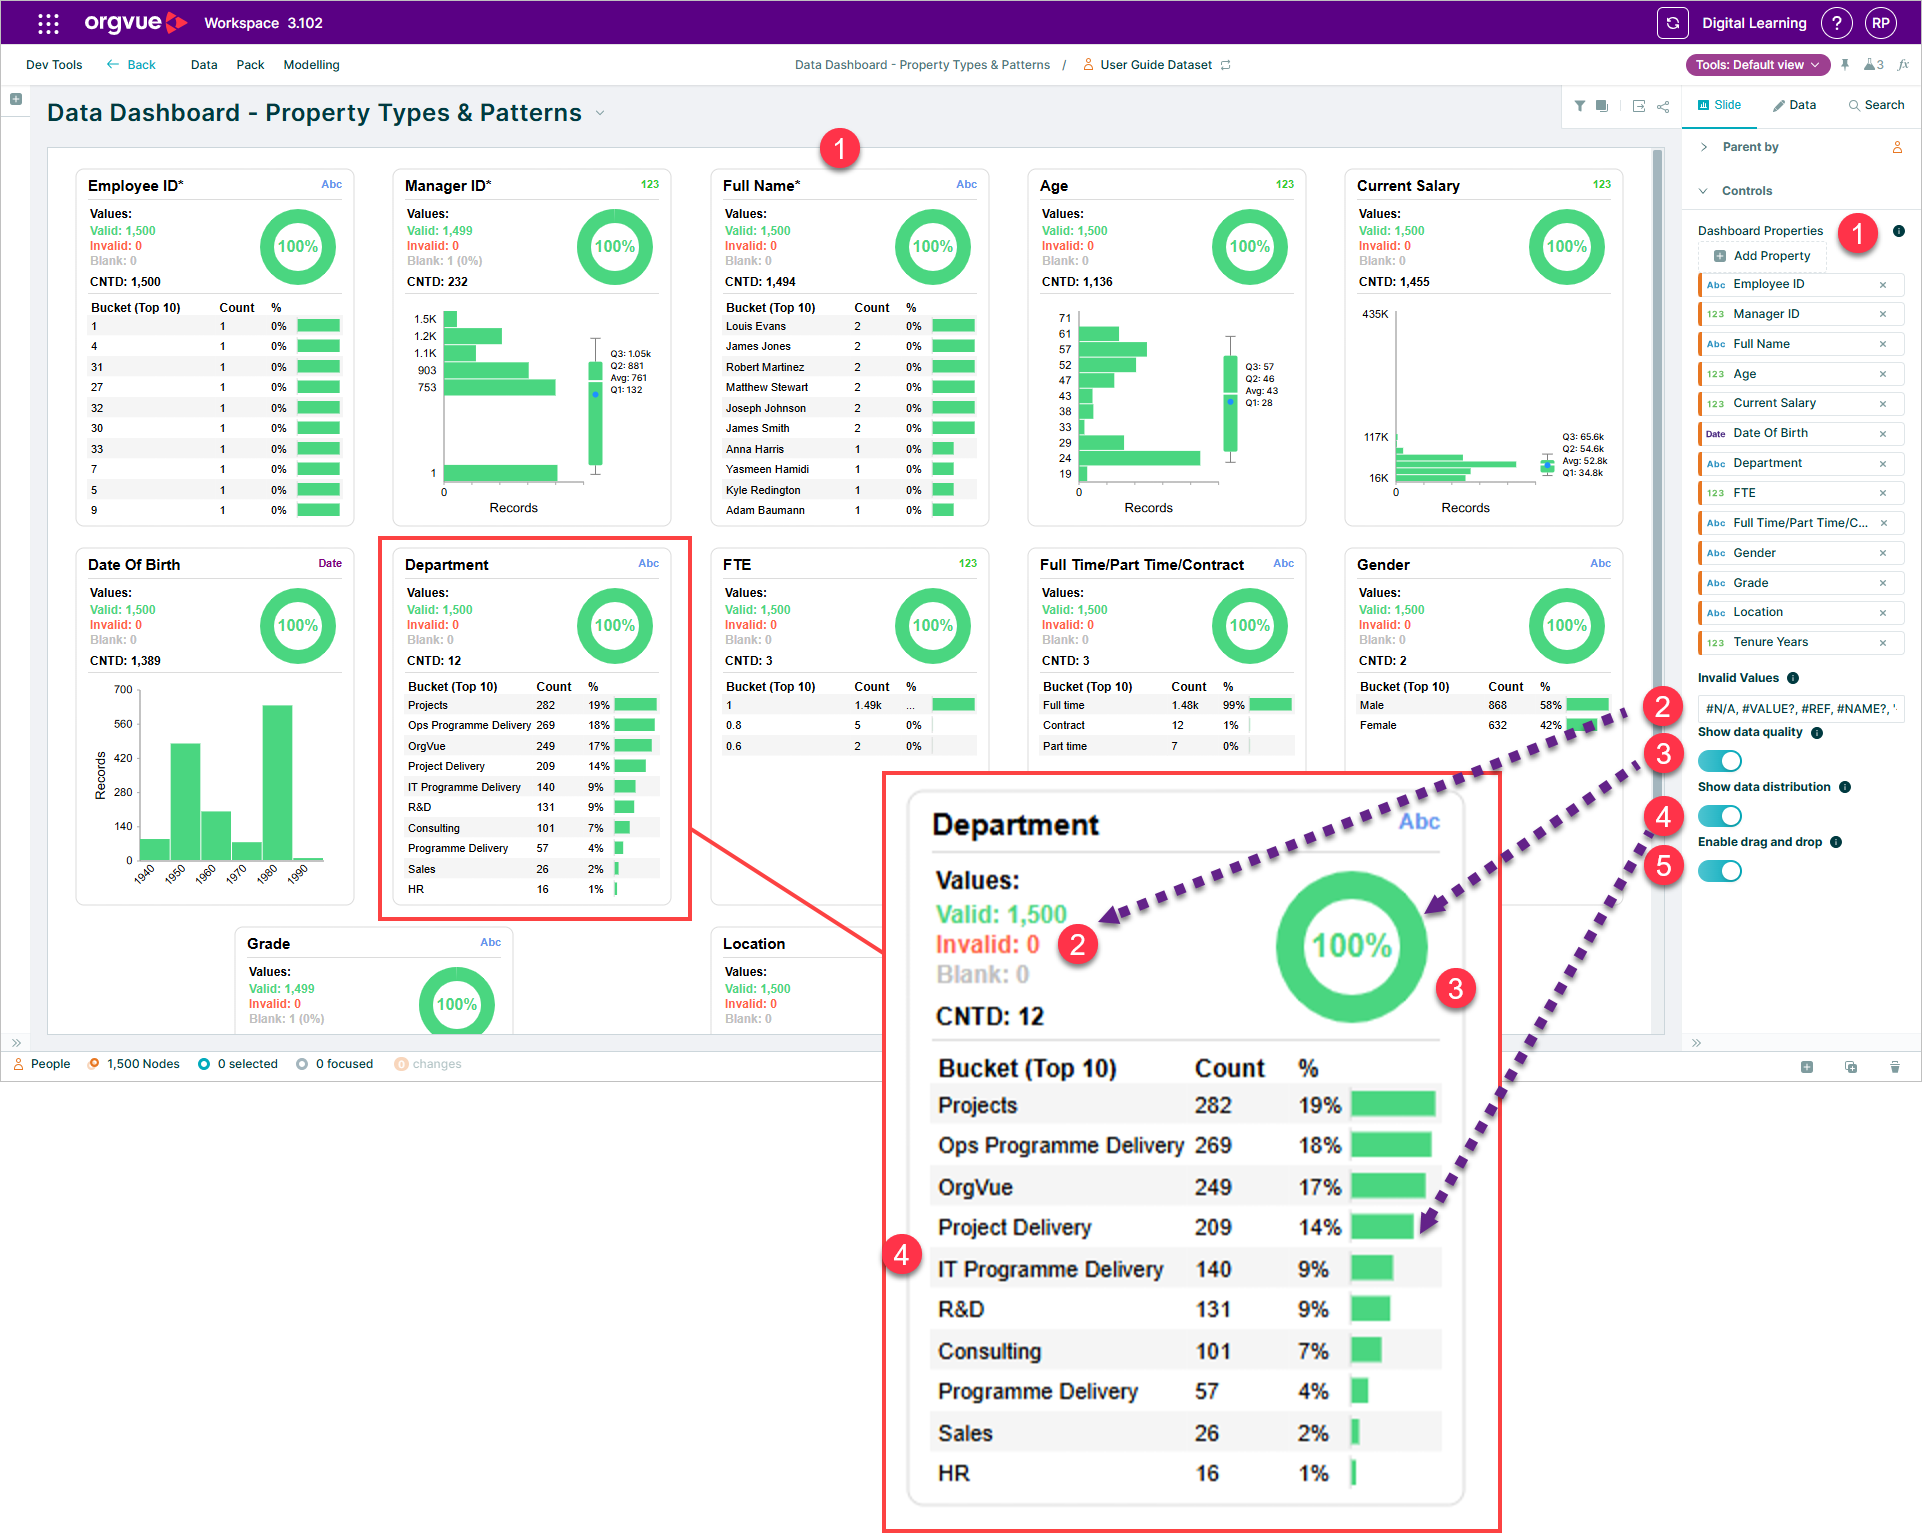
- The Dashboard will automatically display key properties as cards. The displayed properties may be changed by selecting additional properties (up to max 25 properties)
- Invalid data values are shown, these values may be updated by adding to existing list
- Show or hide data quality indicator
- Show or hide data distribution
- Enable drag and drop
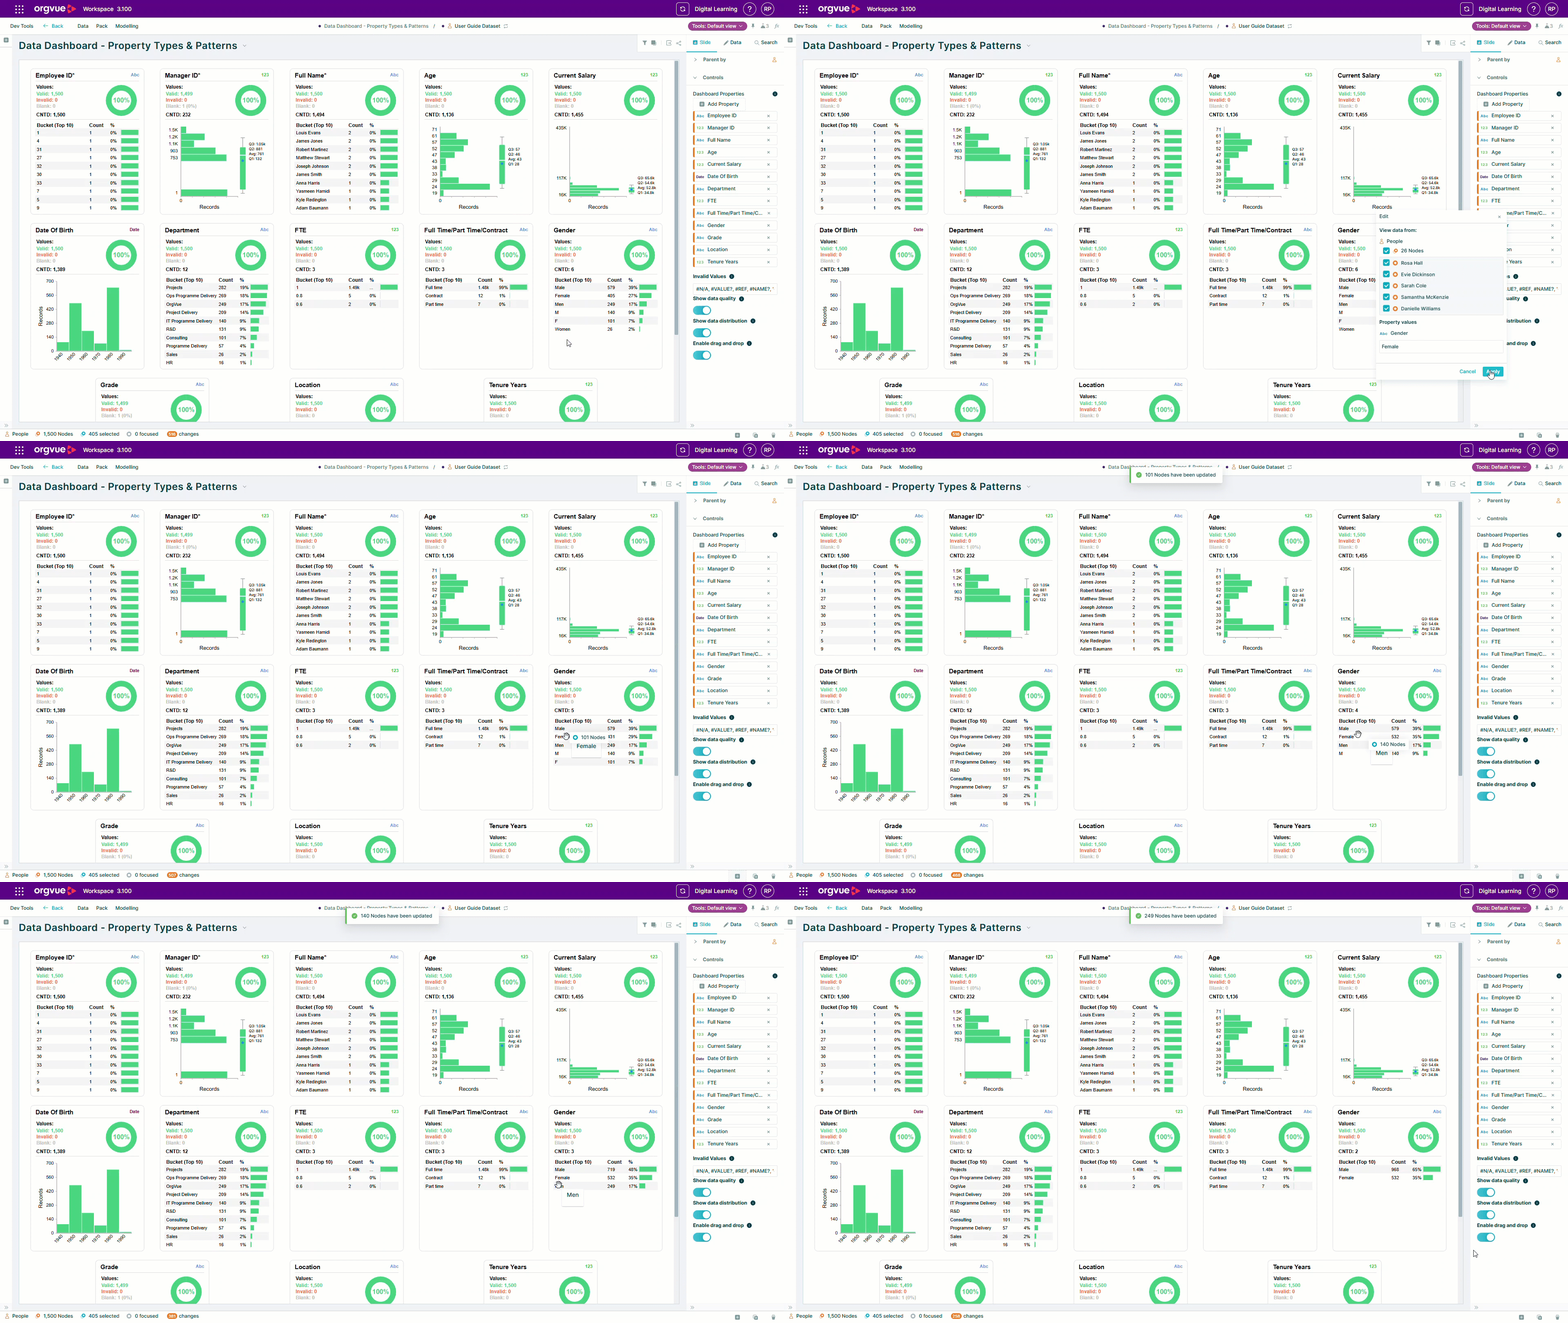
Drag and Drop to update values
Similar to the filter panel and color legend, node buckets may be dragged and dropped within a card to update data values.